Analytical Dashboard
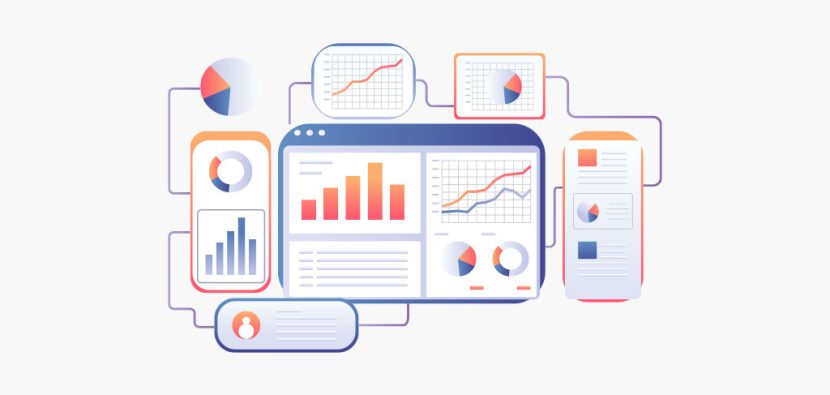
All the immediate statistics are at your finger-tips on the dashboard. SalzPoint has provided not just a colourful user-interface and pleasing design, but we have also showcased key analytics (represented by graphs and pie-charts) to provide a bird’s-eye view of your supply-chain:
- the overall sales performances with primary and secondary sales distinction (offered with custom-friendly date-filters)
- top-performing outlets, top-10 salespersons, etc. are auto-generated
- indicative trends (products, geographies, brands, etc.) and critical insights into them
- prompt management of your channel-partner ecosystem (superstockists, distributors, etc.) including prevention of unwarranted increases in their stock-ins or inventories and yours too
- payments collection statuses and such other critical data-points for taking strategic decisions and planning for your future production cycle
- a key feature is also a real-time update of your field-staff’s current location so that you are at ease knowing the whereabouts of some of your more whimsical salespersons
Why choosing us
What we offer
Analyzing IT services
We help transform the world’s most important businesses into vigorous organizations that anticipate the agile unpredictable, adapt rapidly to disruption and outcompete opposition. We work with clients who not hide from the future but want define clients with high potential and high ambition.
We help transform the world’s most important businesses into vigorous organizations opposition. We work with clients who not hide from the future but want define clients with high potential and high ambition.

